fahimipour2020mapping
Mapping the bacterial metabolic niche space
The rise in the availability of bacterial genomes defines a need for synthesis: abstracting from individual taxa, to see larger patterns of bacterial lifestyles across systems. A key concept for such synthesis in ecology is the niche, the set of capabilities that enables a population's persistence and defines its impact on the environment. The set of possible niches forms the niche space, a conceptual space delineating ways in which persistence in a system is possible. Here we use manifold learning to map the space of metabolic networks representing thousands of bacterial genera. The results reveal a metabolic niche space with a complex branching geometry, whose branches constitute major strategies spanning life in different habitats and hosts. We further demonstrate that communities from similar ecosystem types map to characteristic regions of this new functional coordinate system, permitting ecological descriptions of microbiomes in terms of large scale metabolic roles that may be filled.
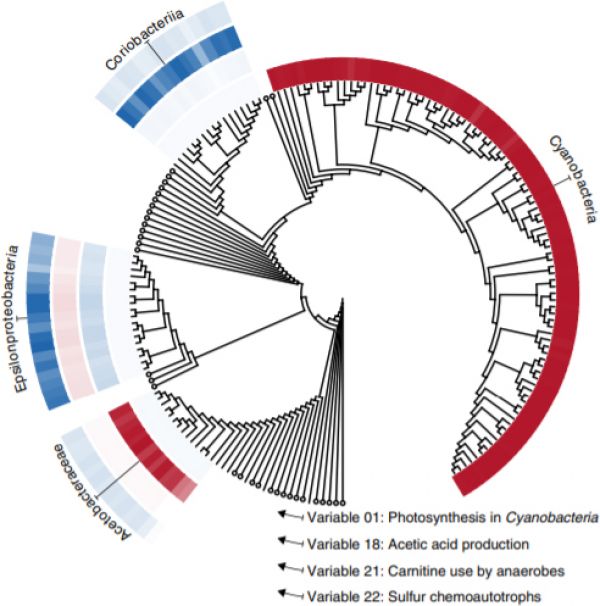
Figure 1: The diffusion map identifies effective bacterial trait variables based on genetic similarity. Variable entries for each genome are visualized as rings of colored tiles near the tips of a phylogenetic tree. Large negative or positive values (saturated reds and blues) indicate strong overlap with the focal strategy, whereas white indicates an absence of these capabilities. Circles are collapsed clades with near-zero entries in each of the four example variables. Clades receiving large negative or positive entries in any of the four example variables are expanded and annotated. The near-absence of semi-saturated tones indicates the strategies represented by these variables are approximately yes-or-no properties encoded by taxa.