aufderheide2013predict
How to predict community responses to perturbations in the face of imperfect knowledge and network complexity
It is a challenge to predict the response of a large, complex system to a perturbation. Recent attempts to predict the behaviour of food webs have revealed that the effort needed to understand a system grows quickly with its complexity, because increasingly precise information on the elements of the system is required. Here, we show that not all elements of the system need to be measured equally well. This suggests that a more efficient allocation of effort to understand a complex systems is possible. We develop an iterative technique for determining an efficient measurement strategy. Finally, in our assessment of model food webs, we find that it is most important to precisely measure the mortality and predation rates of long-lived, generalist, top predators. Prioritizing the study of such species will make it easier to understand the response of complex food webs to perturbations.
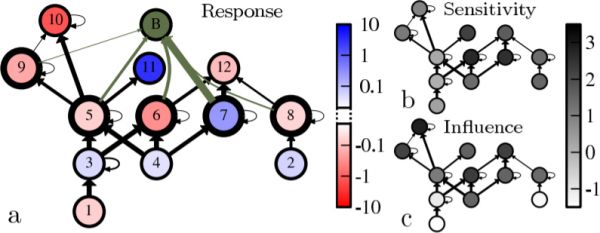
Figure 1: Predicted response of the Gatun Lake food web to the perturbation caused by the introduction of the peacock
bass. Shown are species (circles) and predator-prey relationships (arrows, in the direction of the biomass flow). In panel a, the peacock bass population (B) is shown, together with its feeding relations. The colour code denotes the response of each species to this perturbation for a specific set of generalized parameter values (see the online material for details). In b) and c) the grey-scale denotes the sensitivity and the influence of each species respectively, approximating its average propensity to be impacted by other species or to impact to other species.