ritterskamp2018revealing
Revealing instabilities in a generalized triadic supply network: A bifurcation analysis
Supply networks are exposed to instabilities and thus a high level of risk. To mitigate this risk, it is necessary to understand how instabilities are formed in supply networks. In this paper, we focus on instabilities in inventory dynamics that develop due to the topology of the supply network. To be able to capture these topology-induced instabilities, we use a method called generalized modeling, a minimally specified modeling approach adopted from ecology. This method maps the functional dependencies of production rates on the inventory levels of different parts and products, which are imposed by the network topology, to a set of elasticity parameters. We perform a bifurcation analysis to investigate how these elasticities affect the stability. First, we show that dyads and serial supply chains are immune to topology-induced instabilities. In contrast, in a simple triadic network, where a supplier acts as both a first and a second tier supplier, we can identify instabilities that emerge from saddle-node, Hopf, and global homoclinic bifurcations. These bifurcations lead to different types of dynamical behavior, including exponential convergence to and divergence from a steady state, temporary oscillations around a steady state, and co-existence of different types of dynamics, depending on initial conditions. Finally, we discuss managerial implications of the results.
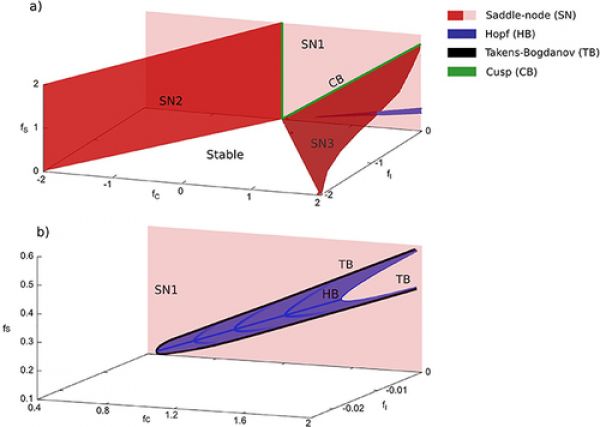
Figure 1: Bifurcation surfaces for identical parameters. (a) Representation of all bifurcation surfaces. (b) Close up of the Hopf bifurcation surface shown in (a). To guide the eye, we draw representative structural curves of the Hopf bifurcation surface (dark blue). Each vertical cross section of the surface is described by a parabola, with its vertex being furthest away from the SN1 surface.